Plan a fishing trip
“When’s the best time to fish near Newport this weekend?”
Finds nearby stations, pulls tide turning points, checks wind and barometric pressure, and identifies the best incoming-tide window.
NOAA — the National Oceanic and Atmospheric Administration — runs a network of tide stations along every U.S. coast. About 300 of them, from Eastport, Maine to Pago Pago, American Samoa. They measure water levels every six minutes. Many also track wind speed, air pressure, and water temperature. All of it gets published as free, public data.
The catch? The raw API isn’t exactly conversational. Station IDs, product codes, datum references, time formats — it’s built for machines, not people.
mcnoaa-tides sits in the middle. It’s a server that knows how to talk to NOAA’s API, and it lets your assistant handle the details. You ask “when’s the best time to fish near Seattle?” and behind the scenes, the nearest station gets found, 48 hours of tide predictions get pulled, weather conditions get checked, and you get a window you can actually plan around.
No API keys. No data wrangling. Just ask.
Plan a fishing trip
“When’s the best time to fish near Newport this weekend?”
Finds nearby stations, pulls tide turning points, checks wind and barometric pressure, and identifies the best incoming-tide window.
Check before you launch
“Is it safe to take the boat out from Seattle today?”
Checks wind, gusts, visibility, water temperature, and pressure trend. Comes back with GO, CAUTION, or NO-GO — and tells you why.
Snorkeling at low tide
“When’s the next good low tide for snorkeling at La Jolla?”
Finds extreme low tides that expose reefs, checks water temperature and wind to confirm the trip is worth the drive.
Tide pooling with kids
“Find the lowest tide this week near Monterey for tide pooling”
Scans a full week of predictions for the deepest lows. Negative values mean the water drops below the usual low-water mark — more pools exposed.
Deploy crab pots
“Should I deploy pots near Anacortes right now?”
Checks tidal phase, runs a deployment briefing against wind and pressure thresholds, and recommends a soak window with a recovery time.
Beachcombing after a storm
“When’s the next low tide at Cannon Beach? I want to look for agates.”
Confirms a recent storm passed through by checking pressure drops, then finds the first post-storm low-tide window.
Ask for a chart and the data renders right in your conversation:
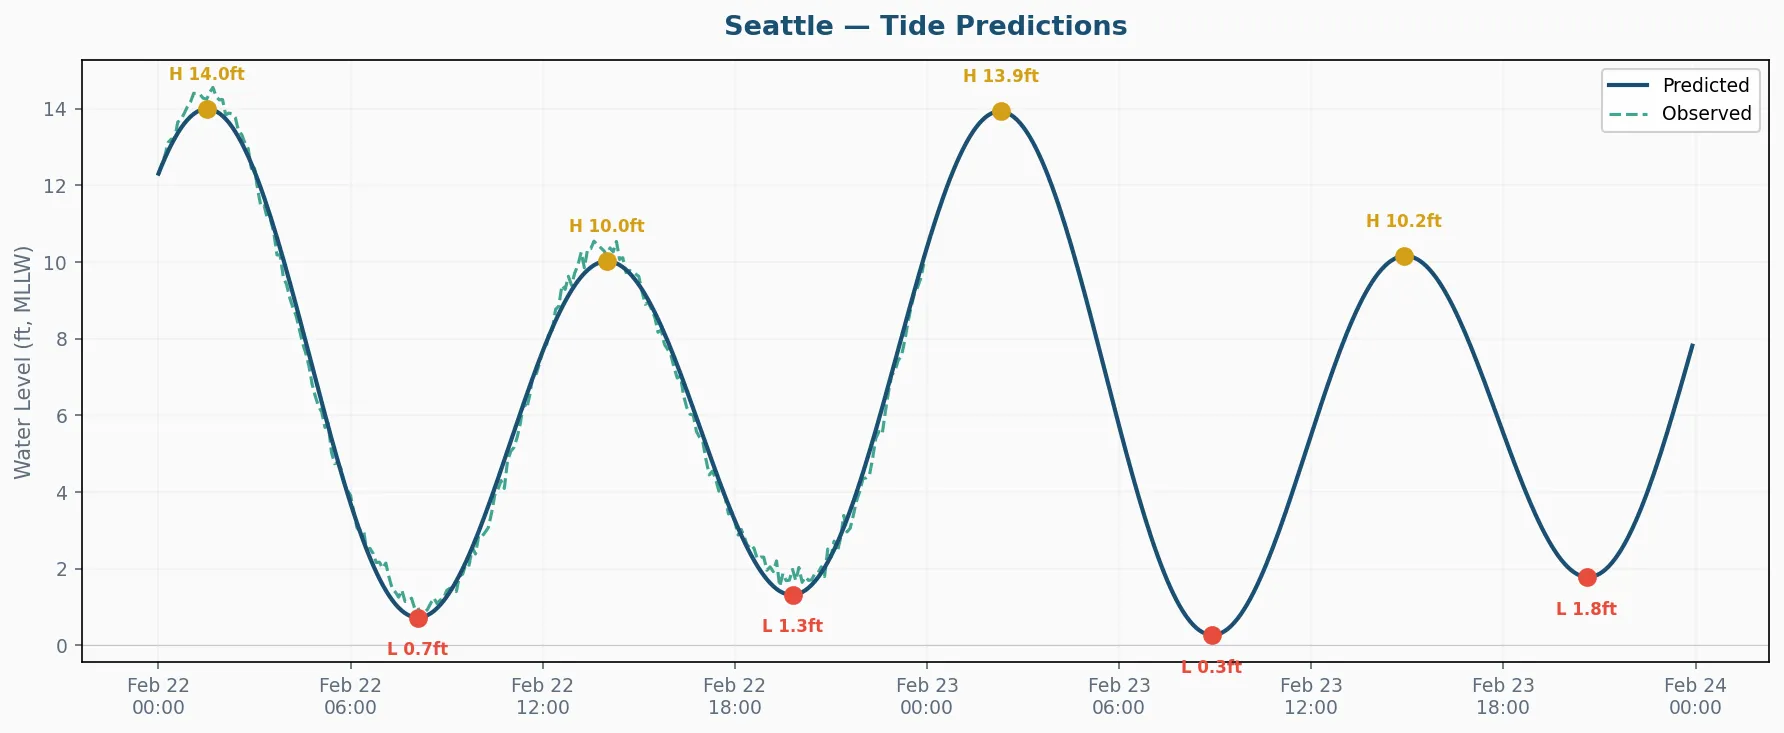
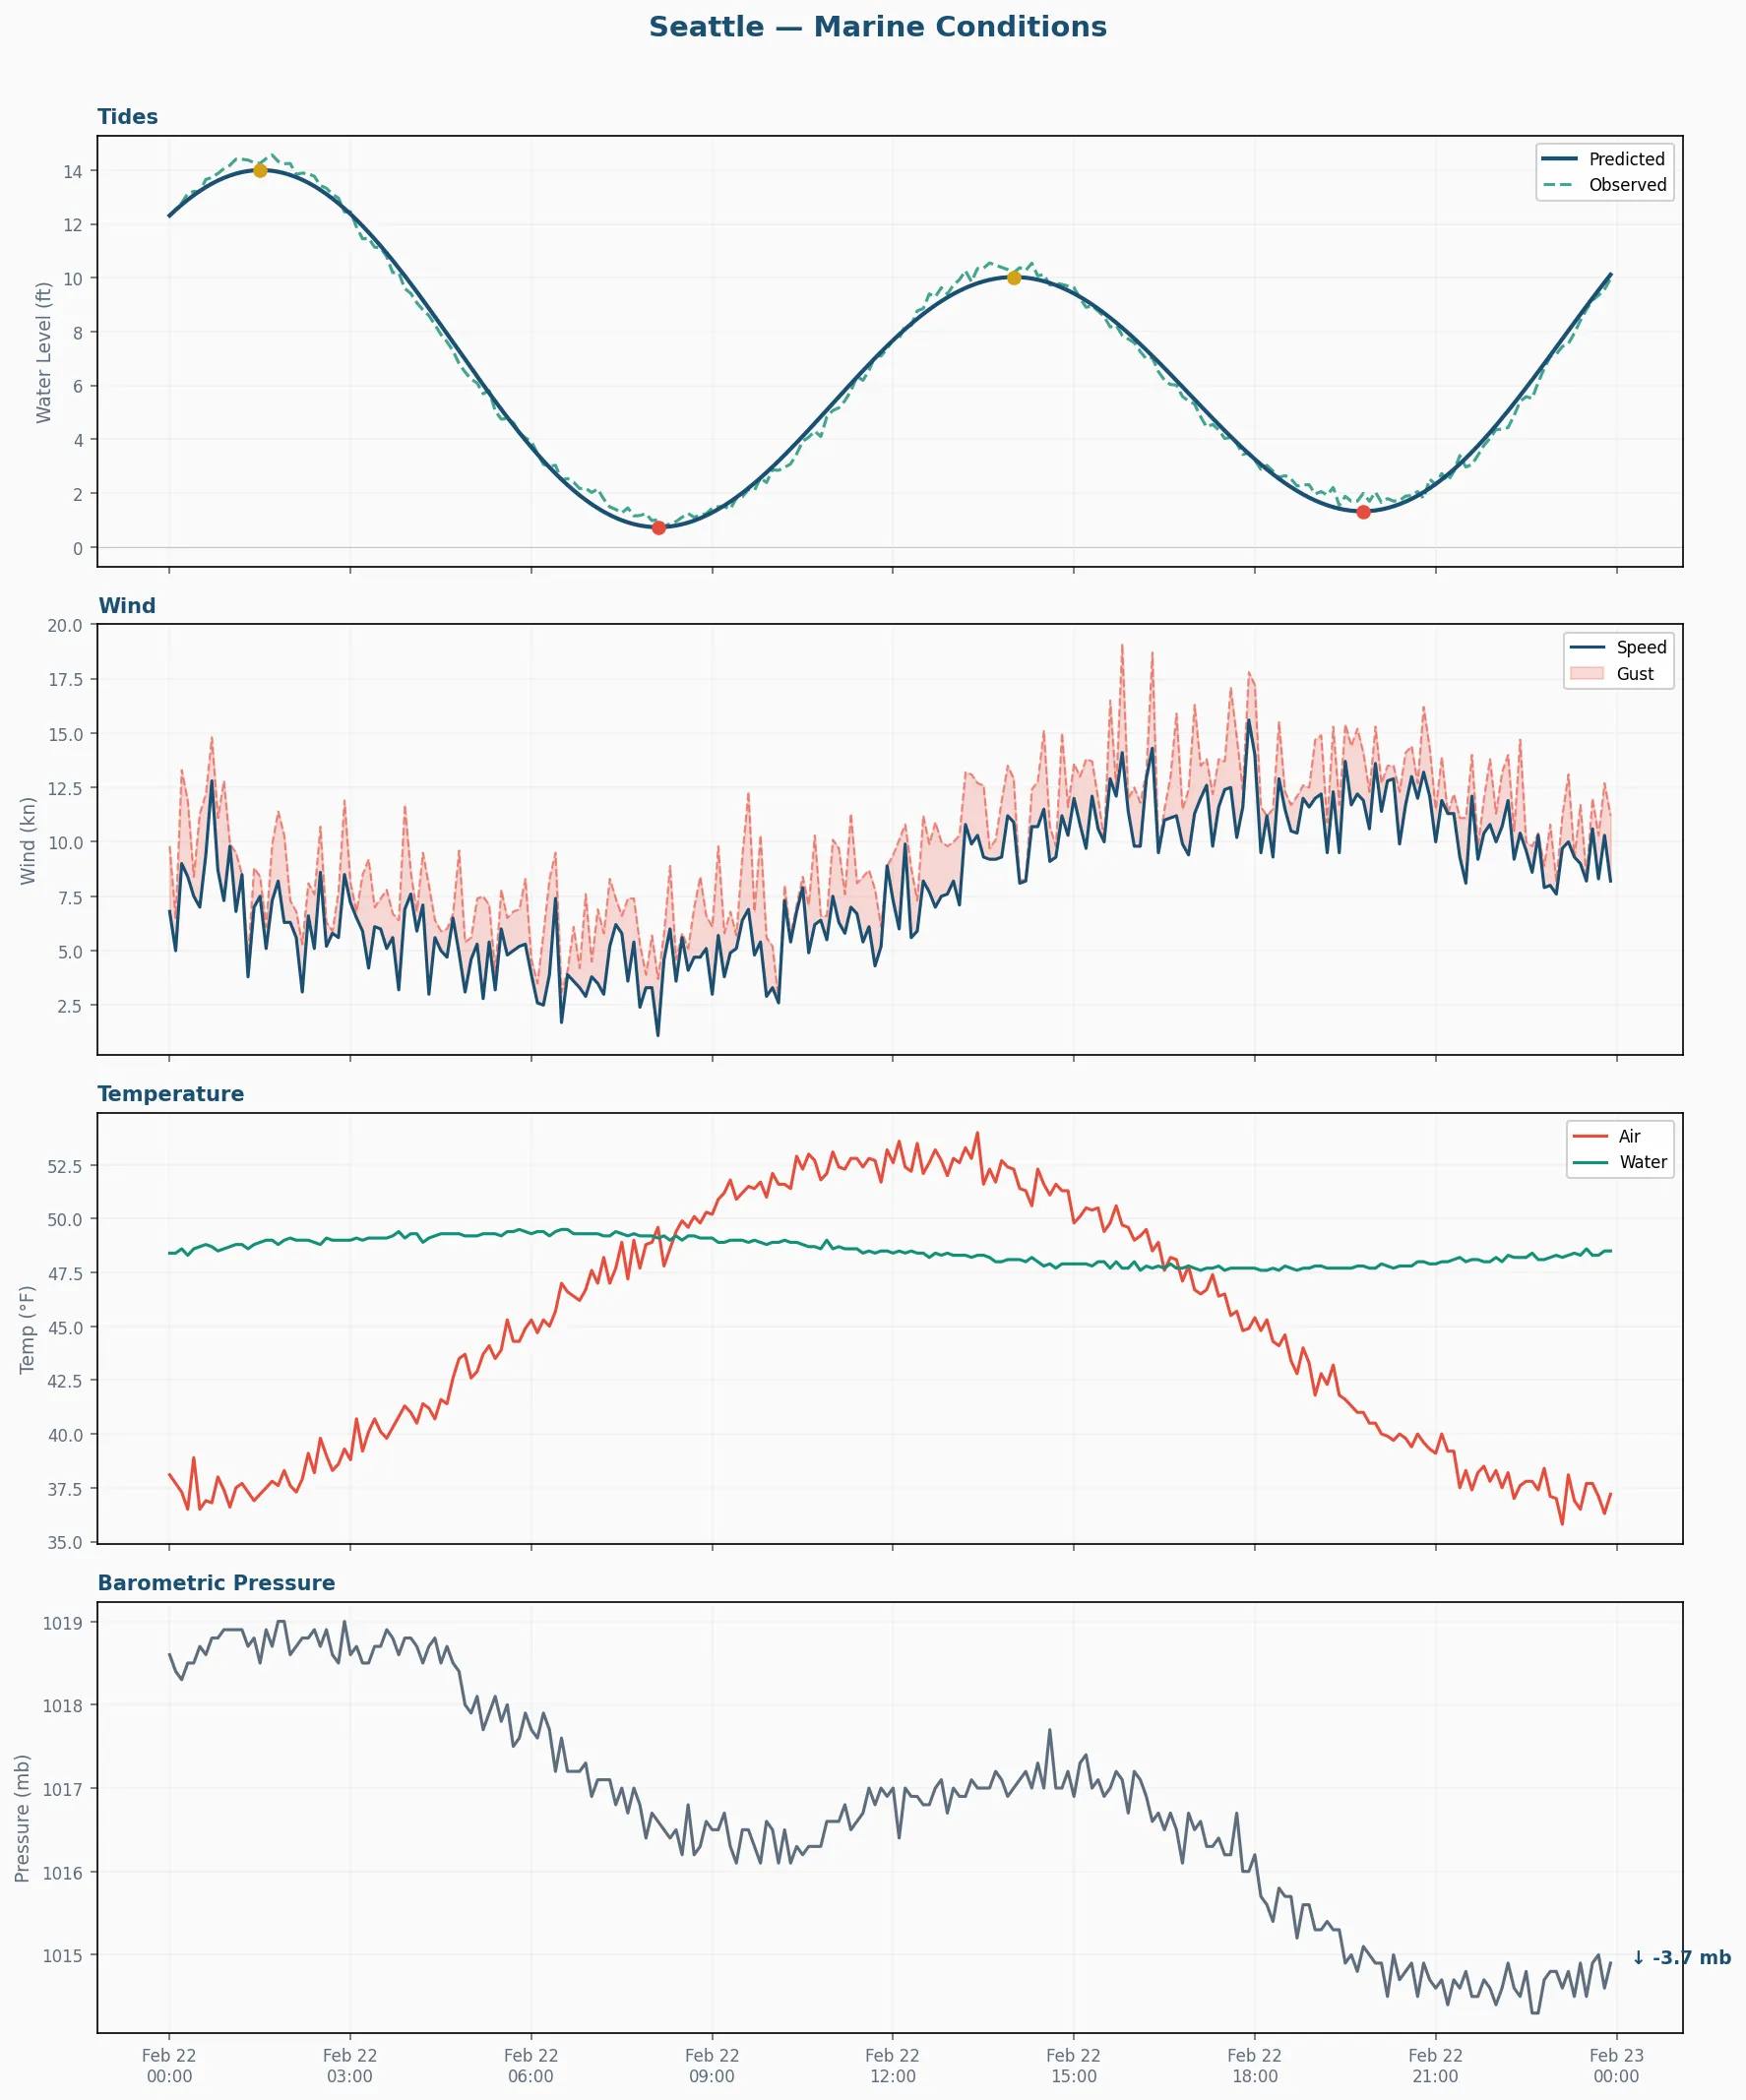
These are real outputs from the visualize_tides and visualize_conditions tools —
learn more about charts →
The server ships with 14 tools, 4 guided workflows, and 3 data resources. If your assistant supports MCP (most do), it can use all of them.
14 Tools
Find stations, pull tides, check weather, classify tidal phases, assess deployment conditions, detect anomalies, generate charts — plus a few more for diagnostics and capability testing.
4 Prompt Templates
Pre-built workflows that walk through multi-step tasks: fishing trip planning, marine safety checks, crab pot deployment, and catch pattern analysis. Your assistant follows the steps, you get the results.
3 MCP Resources
Station catalog, station detail, and nearby station lookup — structured data your assistant can read directly without calling a tool first.
Visualization
Tide charts and multi-panel conditions dashboards, rendered as PNG (shows inline) or interactive HTML (pan, zoom, hover for values).
Run the server — no permanent install needed:
uvx mcnoaa-tidesThen register it with your MCP client. Most accept a JSON config:
{ "mcnoaa-tides": { "command": "uvx", "args": ["mcnoaa-tides"] }}A public instance runs at https://mcp.mcnoaa-tides.warehack.ing/ —
no install needed. Connect from your browser.
Claude.ai
Settings → Connectors → Add custom connector — paste the URL and save. No auth needed.
Available on Pro, Max, Team, and Enterprise plans.
ChatGPT
Settings → Developer Mode → Connectors → Create — name it “NOAA Tides”, paste the URL, save.
Available on Plus, Team, Enterprise, and Edu plans.